
MASTERING FOREX LINE TRADING: A COMPREHENSIVE GUIDE
This article will focus on how you can trade the forex line chart on Dominion Markets. Before we dive into the nitty gritty, let us look at what a forex line chart is.
INTRODUCTION TO FOREX LINE CHARTS
A line chart is a simple way to display an asset's historical price movements. It connects data points with a continuous line and usually presents only the closing prices of forex pairs as they evolve. Traders can use line charts for any timescale. However, they commonly use them for tracking day-to-day price fluctuations.
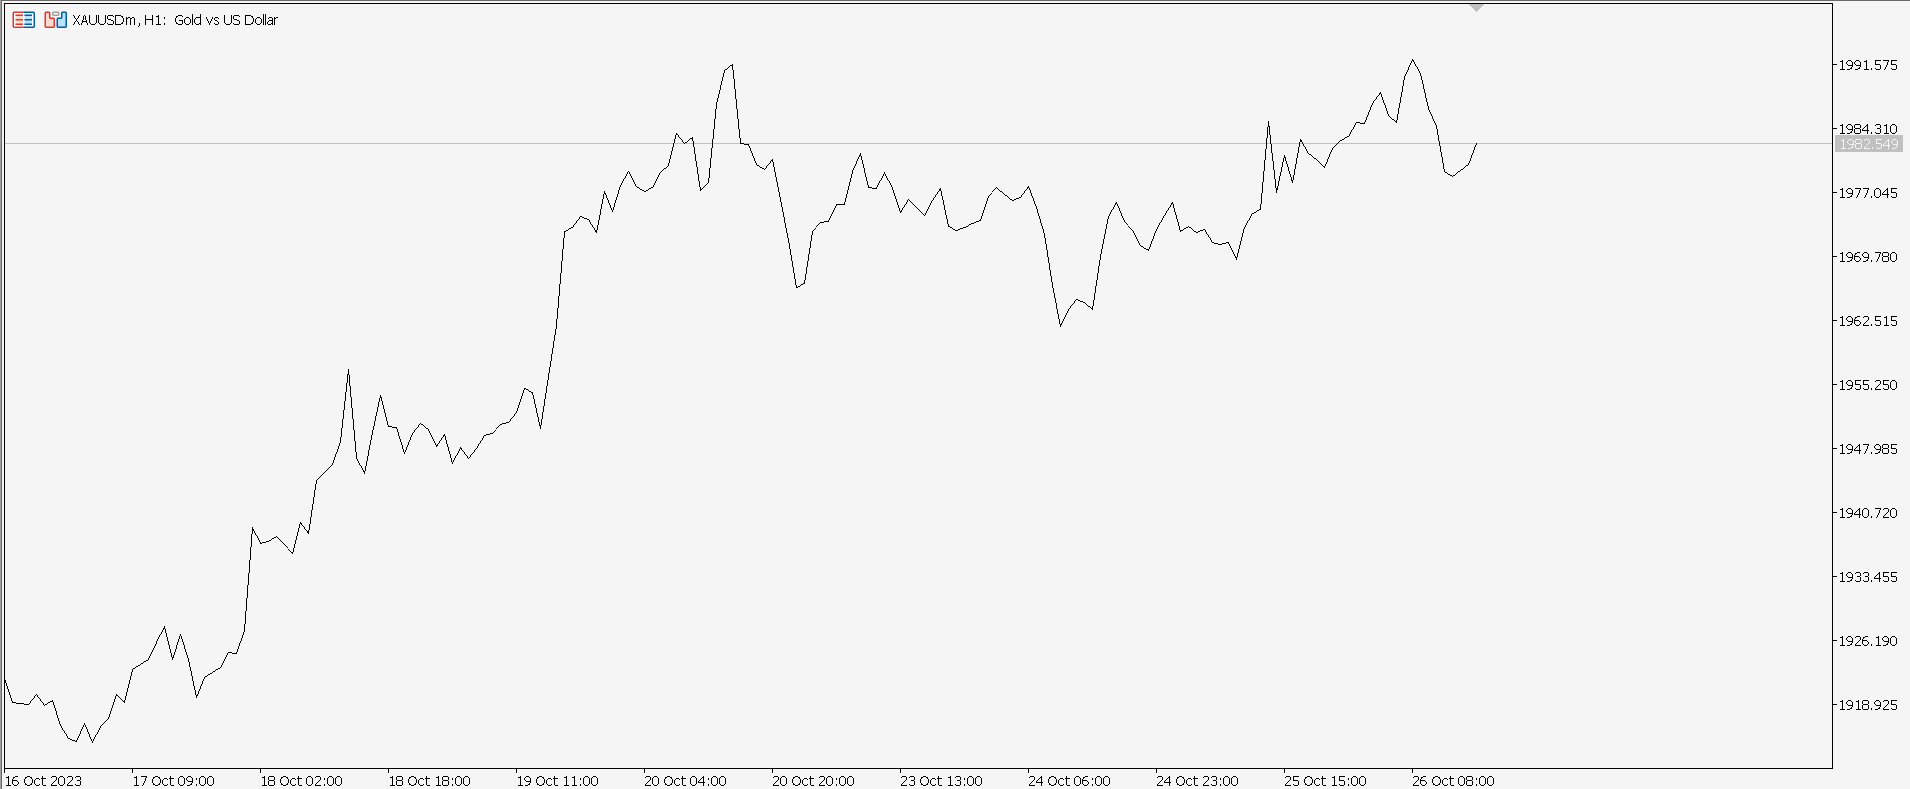
Forex Line Chart
When analyzing a forex pair’s chart, traders can become overwhelmed by too much information. In the trading world, this situation is known as 'analysis paralysis.' Using charts with excessive price data and indicators can generate numerous signals, causing confusion and making trading choices more complex. Line charts remove the noise and simplify the price movements.
Using a line chart assists traders in easily identifying significant support and resistance levels, trends, and identifiable chart patterns.
Because of their simplicity, line charts are also suitable for new traders. They aid in teaching basic chart reading abilities before moving on to more complex approaches, such as reading Japanese candlestick patterns or mastering point and figure charts. Traders can readily apply moving averages and volume to a line chart.
UNDERSTANDING LINE CHART COMPONENTS
A forex line chart on Dominion Markets has the following basic components:
X-axis: The x-axis usually contains the time. This time component changes depending on the chart timeframe. The time ranges from minutes to hours, days to weeks, months to years.
Y-axis: The y-axis of a line chart contains the forex pair price you are trading. The price on this axis is divided into pips or points.
Line: The line is a major component of a forex line chart. It connects the closing prices of the currency pair for every time interval.
SETTING UP YOUR TRADING PLATFORM FOR LINE CHARTS
Setting up your trading platform for line charts on Dominion Markets is very simple if you follow these steps.
- First, you must log into your Dominion Markets account through their website.
- Once logged in, click the platforms button to the left of the open execution window.
- Select the platform of your choice. Dominion Markets offers the MT5 platform and the cTrader platform. Select a platform. We will use the MT5 platform for this illustration.
- Choose the instrument you want to trade on the platform, and then select the line chart option at the top.
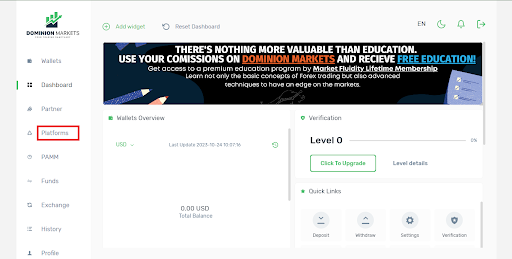
Dominion Markets Platforms Button
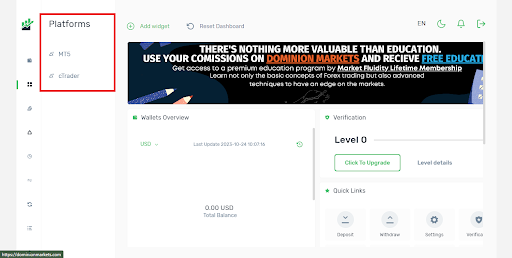
Dominion Markets Platforms Offered
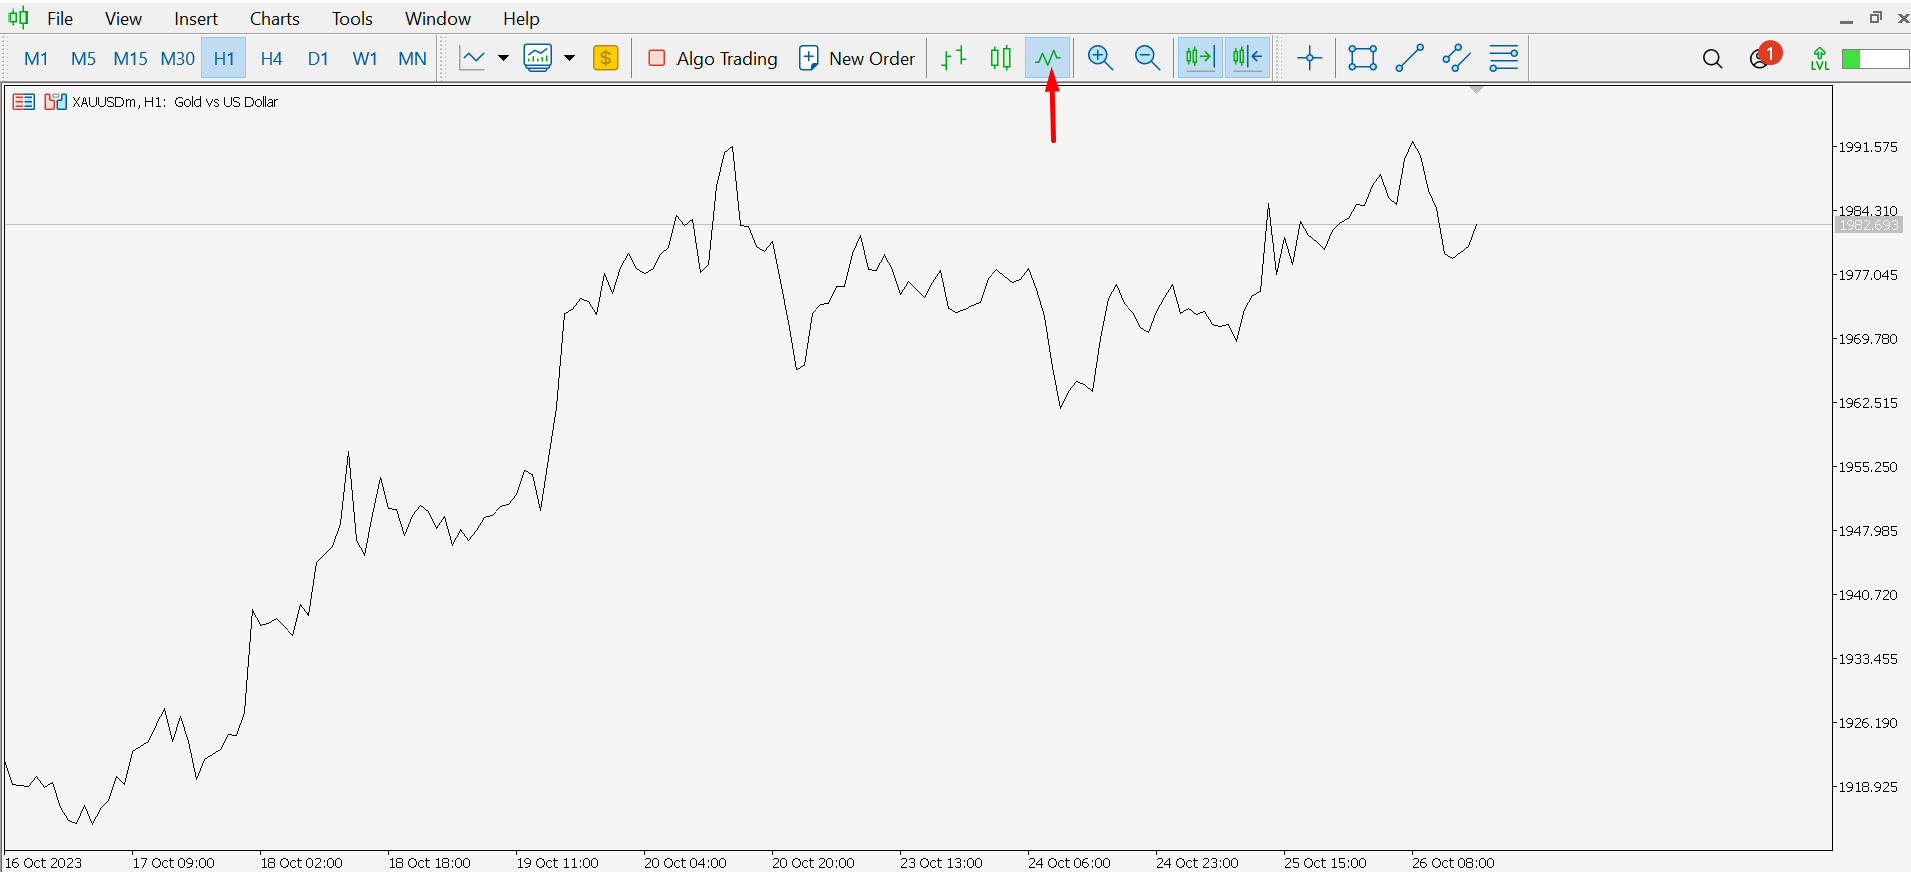
Line Chart Button
READING AND INTERPRETING LINE GRAPHS
A line chart shows traders where the price of a forex pair has moved over a specified period. Line charts decrease noise from less crucial moments in the trading day, such as the open, high, and low prices, because they often only use closing prices.
Because closing prices constitute a common picture of an instrument's activity, line charts are popular among traders. The line connects the closing prices, thus giving you a smooth representation of how the price has faired in a particular period.
IDENTIFYING TRENDS WITH LINE CHARTS
There are two primary methods for identifying trends on a forex line chart:
Visual examination
To identify trends visually, examine the chart and note whether the price makes higher highs and higher lows (uptrend) or lower highs and lower lows (downtrend). The currency pair is in an uptrend if the price makes higher highs and lows. The currency pair is downtrend if the price makes lower highs and lower lows.
It is crucial to remember that trends are only sometimes flawless. When the price does not move in a straight line, there will often be periods of consolidation or correction. If the general trend is evident, however, these periods of consolidation or correction should be viewed as opportunities to enter trades in the trend's direction.
Indicators of technical significance
You can utilize some technical indicators to aid in the identification of trends. Moving averages are the most popular.
Moving Averages
A moving average is a technical indicator that computes the average price of a currency pair over a given period. By looking for crossovers between different moving averages, you can use moving averages to discover patterns. For example, you can interpret a shorter-term moving average crossing above a longer-term moving average as a bullish indicator.
UTILIZING SUPPORT AND RESISTANCE LEVELS
During a market downturn, prices drop due to an oversupply compared to demand. As prices fall, they become more attractive to potential buyers waiting. Gradually, demand catches up with supply, and at this point, prices stabilize, creating a support level.
Support is the polar opposite of resistance. Prices go up when demand surpasses supply. As prices increase, the urge to sell eventually becomes stronger than the desire to buy. This can happen for some reasons. Dealers may have judged that prices are too high or have reached their peak. It could be purchasers' unwillingness to enter new holdings at such high valuations. It could be for any number of different reasons.
TRADING STRATEGIES WITH FOREX LINE CHARTS
Here are some strategies you can use on Dominion Markets’ line charts.
- Trend following is a technique that involves buying currency pairs in an upswing and selling currency pairs in a decline. Trend following can be a highly profitable approach, but it is critical to understand the hazards associated. Trends can change direction at any time, so it is critical to use a stop-loss order to protect your winnings.
- Breakout trading entails purchasing currency pairs broken out of a trading range or consolidation pattern. Breakout trading can be a highly profitable approach, but it is critical to understand the hazards associated.
- False breakouts are possible, which implies that the price may break out of a trading range just to retrace back inside it. A stop-loss order should be in place to protect your winnings in the event of a false breakout.
RISK MANAGEMENT TECHNIQUES FOR LINE CHART TRADING
Here are some of the risk management techniques for line chart trading.
- Use Stop Loss Orders
- Use Trailing Stop Loss Orders
When you employ a stop-loss order, you can avoid suffering huge losses if your trade goes against you. You can use stop-loss orders for long and short trades and tailor your stop-loss to suit your tastes. A good stop-loss order can assist you in making the most of your investments while avoiding large losses that could jeopardize your trading account.
As a short-term trader, it's important to use trailing stop-loss orders. These orders help you make the most of your trade and boost your earnings when you plan to hold your position for a short period. Trailing stop-loss orders works by narrowing the gap between where you entered the trade and where you set your stop loss, which helps reduce your potential losses.
PSYCHOLOGY FOR SUCCESSFUL LINE TRADERS
Trading psychology is about how your feelings and thoughts affect your success in trading. It's about your personality and behavior, which can be as important as what you know or how much experience you have in placing trades.
Discipline and risk-taking are two of the most important parts of trading psychology, as their implementation is vital to the success of a trader's trading plan. Trading psychology is often connected with fear and greed, although hope and remorse also play roles in trading behavior.
ADVANCED LINE TRADING TOOLS AND INDICATORS
Traders utilize technical indicators to gain insight into asset supply, demand, and market psychology. These signs, when combined, form the foundation of technical analysis. Metrics like trade volume can indicate if a price move will persist. You can use Indicators to produce buy and sell signals.
The following are seven of the greatest indicators for line trading:
- Aroon oscillator
- Moving average convergence divergence (MACD)
- Relative strength index (RSI)
- Stochastic Oscillator
- On-balance volume (OBV)
- Accumulation/distribution line
- Average directional index
COMPARING LINE CHARTS TO OTHER CHART TYPES
Line charts are the most basic Forex charts, yet they can identify trends. Other forex formats, such as bar charts and candlestick charts, provide more information about a currency pair's price movement but can be more difficult to comprehend.
Your trading style and preferences will determine the optimal chart type for you. If you are a newbie, you should begin with line charts, which are the easiest to interpret. However, as you gain experience, you may want to experiment with other chart styles, such as bar charts or candlestick charts, which provide additional information regarding price movement.
CONCLUSION
Line charts are simple to interpret. These charts comprise a line that connects the closing prices of the instrument you are trading. Line charts on the Dominion Markets have various benefits, including the fact that they simplify complex information on forex pairs. Line charts are simple to use for novice traders.
You can access forex line charts on Dominion Markets through either the MT5 or cTrader platform. Join Dominion Markets today and trade the forex line charts.